The “default” choice of Ingress controllers for most Kubernetes clusters, is often Nginx. People are creatures of habit. This often leads to, that they choose the most used service.
For many years, GitLab has made it easy to set up and manage a Nginx controller through their “Managed Apps” solution. However, in Gitlab version; 14.0, this feature has been deprecated. This has led to, that the Nginx Ingress controllers previously managed by Gitlab no longer receives updates, so users now must do the job of managing and updating the Ingress Controllers themself.
 Traefik.io
This deprecation was one reason for a particular client of ours to seek another solution. And for the reasons outlined below, we eventually decided upon Traefik.
The Traefik choice
 When we chose the new Ingress Controller, we set up some criteria, to help us choose the right controller for going forward.
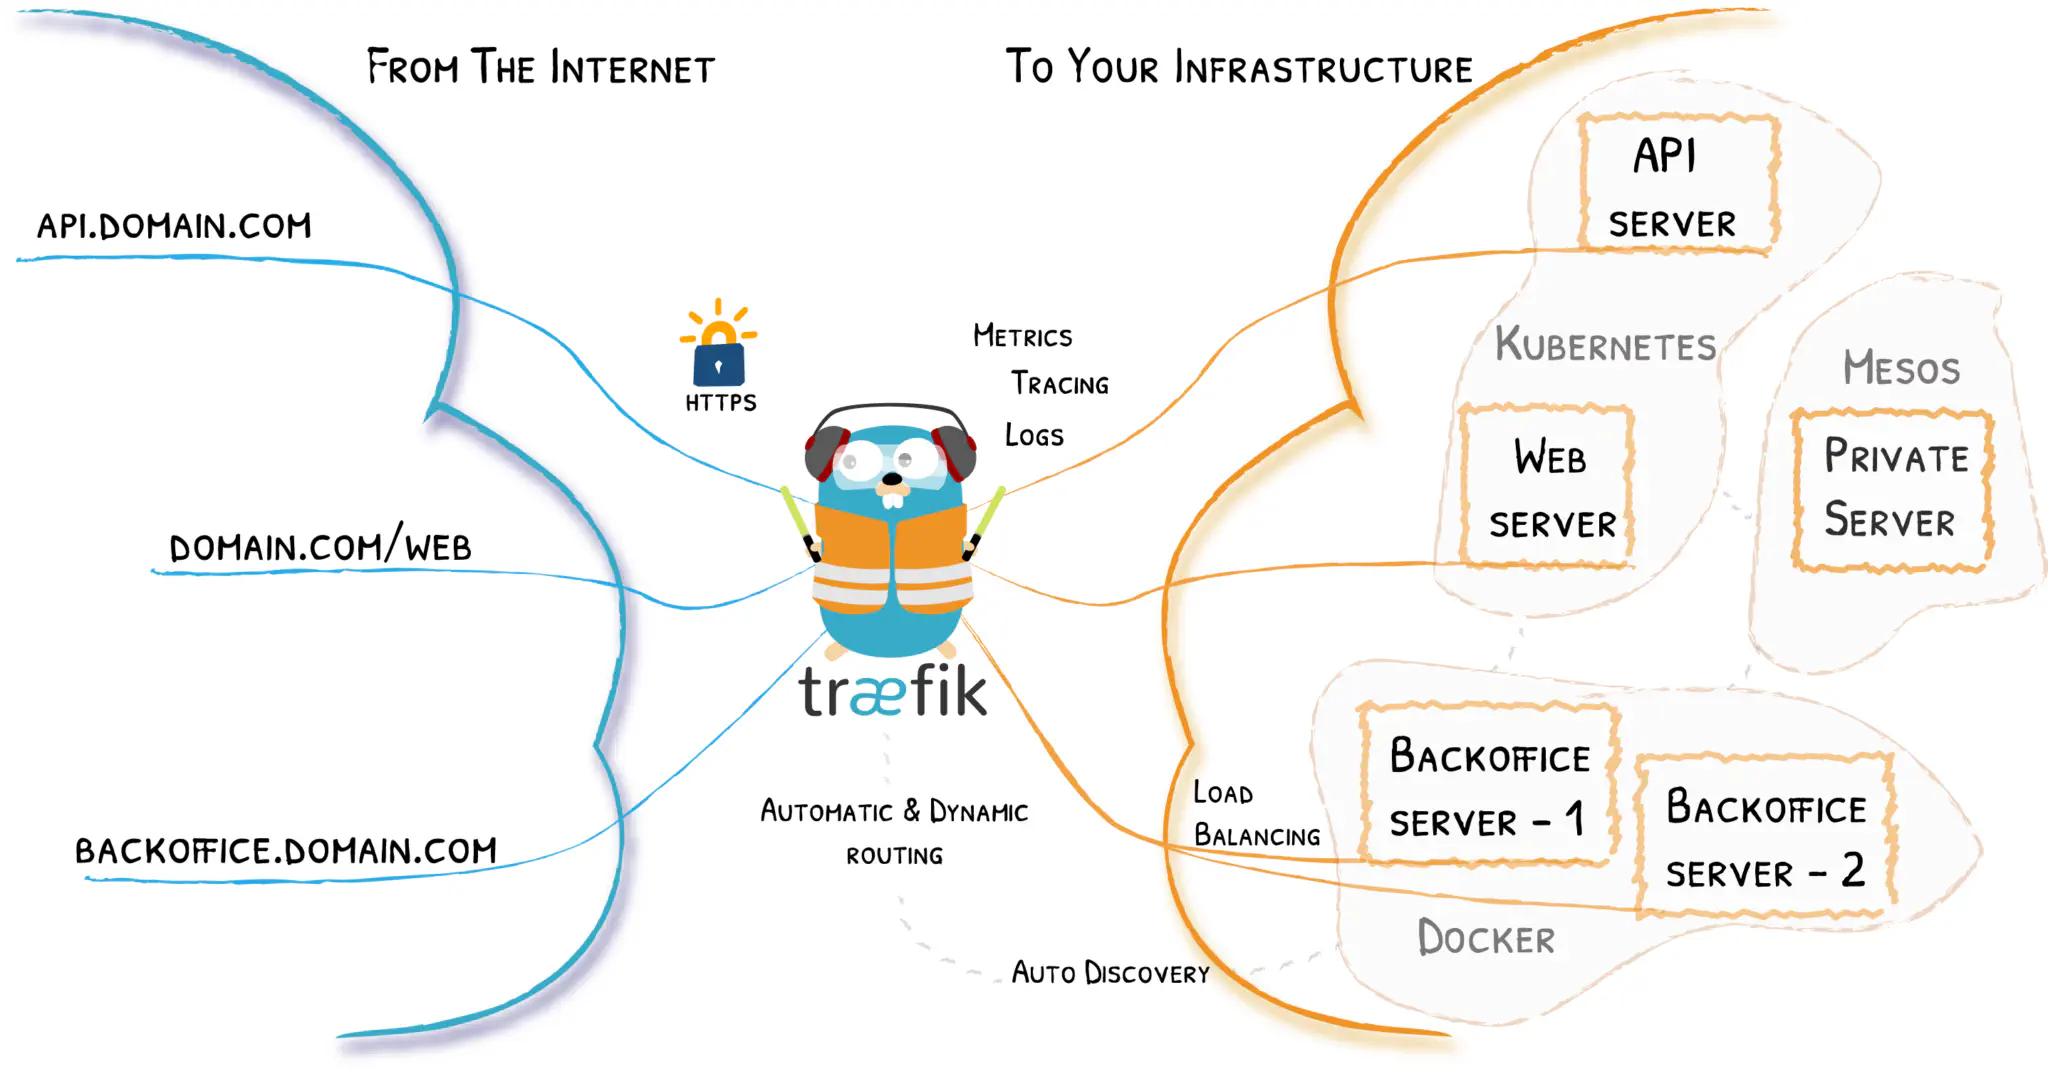
- Better monitoring was on the top of the list, and Traefik fell spot on into this category with both their built-in monitoring service “Pilot”, and especially the ability to export data in different formats such as Prometheus.
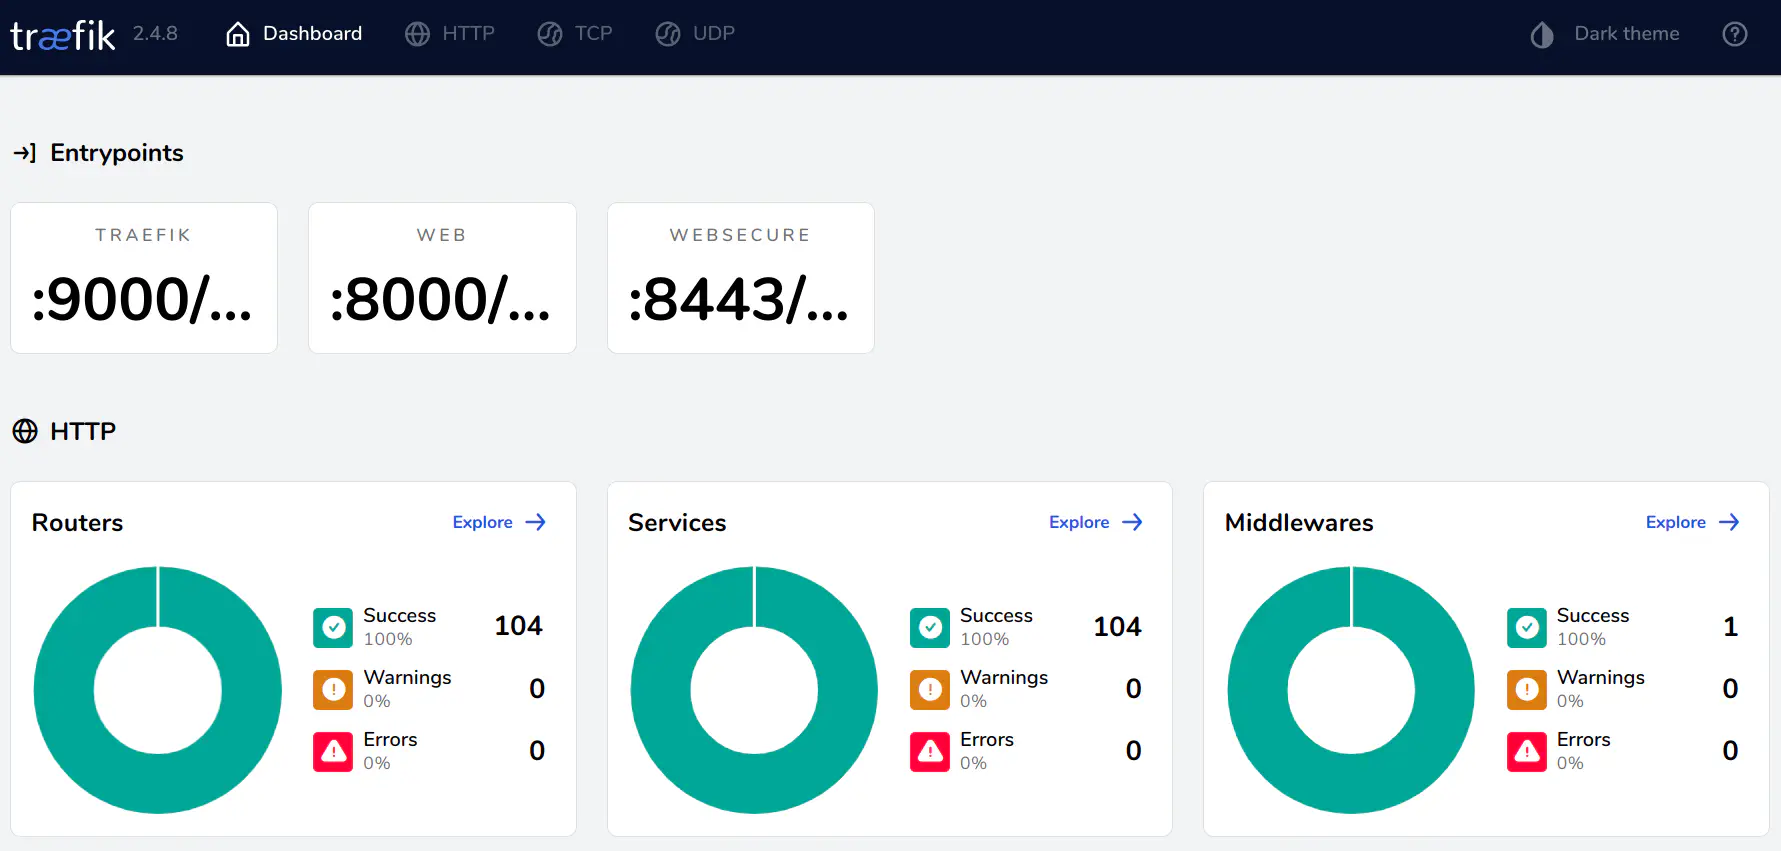
Traefik also ships with a built-in dashboard for monitoring services and proxy routes, which you can lock down with an OAuth middleware.
All these features combined with high performance, and stability really paved the way for us to choose Traefik.
Setting up and configuring Traefik
The preferred way of installing Traefik is for most people, with the Helm chart managed by Traefik. It automatically sets up a deployment with a single replica, roles for rbac, and LoadBalancer service. Although, in our setup, we needed a bit more than the one replica. By tweaking some values, we quickly managed to run a DaemonSet with the NodeSelector set to production nodes, and set a high priority group on the containers, by adding a priority class to the cluster.
These small changes ensure Traefik’s uptime, by running a container on each production node, with a higher priority than the other containers in the cluster. The following command shows what the Traefik namespace will look like with a production setup of 6 nodes:
❯ kubectl get pods
NAME            READY  STATUS    RESTARTS  AGE
traefik-8zjlk   1/1    Running   0         12d
traefik-4xdjg   1/1    Running   0         12d
traefik-f4jnl   1/1    Running   0         12d
traefik-krxxs   1/1    Running   0         12d
traefik-mbl5p   1/1    Running   0         12d
traefik-tnbv5   1/1    Running   0         12d
With the Traefik containers running, we can create an IngressRoute to expose the dashboard to the world. Applying the following manifest to the cluster, allows Traefik to proxy requests on traefik.example.com/dashboard to the internal dashboard service:
apiVersion: traefik.containo.us/v1alpha1
kind: IngressRoute
metadata:
  name: traefik-dashboard-ingress
  namespace: traefik
spec:
  entryPoints:
    - web
   routes:
    - match: Host(`traefik.example.com`) && (PathPrefix(`/dashboard`) || PathPrefix(`/api`))
      kind: Rule
      services:
        - name: api@internal
          kind: TraefikService
Adding extra features to Traefik
The IngressRoutes in the cluster only creates a route for the Traefik proxy. A DNS record is still needed to access the dashboard. The DNS record needs to be pointing at the Traefik LoadBalancer.
By utilizing the repository ExternalDNS we can automate this against providers such as Cloudflare, AWS Route 53, and GCloud DNS. With the ExternalDNS container setup, adding the following resource to the cluster will create a DNS record pointing to the Traefik LoadBalancer automatically.
apiVersion: externaldns.k8s.io/v1alpha1
kind: DNSEndpoint
metadata:
  name: traefik-dashboard
  namespace: traefik
spec:
  endpoints:
    - dnsName: traefik.example.com
      recordTTL: 1
      recordType: A
      targets:
         - <Traefik-LoadBalancer-IP>
With the Traefik dashboard exposed to the world, it’s a good idea to lock it down with eg. OAuth authentication.
Traefik already has a built-in Middleware system you can use on any IngressRoutes. The thomseddons forward auth repository makes it very easy to add the functionality to login with services such as GitHub, GCloud, etc. Running the thomseddons container in the cluster and adding the following middleware to IngressRoutes such as the dashboard, will prompt the user for authentication automatically before accessing the service:
apiVersion: traefik.containo.us/v1alpha1
kind: IngressRoute
metadata:
  name: traefik-dashboard-ingress
  namespace: traefik
spec:
  entryPoints:
    - web
  routes:
    - match: Host(`traefik.example.com`) && (PathPrefix(`/dashboard`) || PathPrefix(`/api`))
      kind: Rule
      services:
         - name: api@internal
           kind: TraefikService
  middlewares:
    - name: traefik-forward-auth
With all these features combined, we have a robust Ingress Controller. The dashboard will show us uptime on the routes and service while exporting all metrics of the routes in a readable Prometheus format. For every service, old and new, we can add an IngressRoute and DNSEndpoint to automatically open it up to the world. And we can lock the service down with OAuth login by adding the middleware.
For our client’s case, the time and effort of moving to Traefik were definitely worth it.
If monitoring and automation are important for you, it could very well be a worthwhile investment for you as well.